Market Feedback and Continuous Improvement
Chapter 14 · Automotive Product Development
Use the infographic for the process overview, then follow the chapter sections for definitions, activities, deliverables, gate evidence, and implementation detail.
Chapter infographic
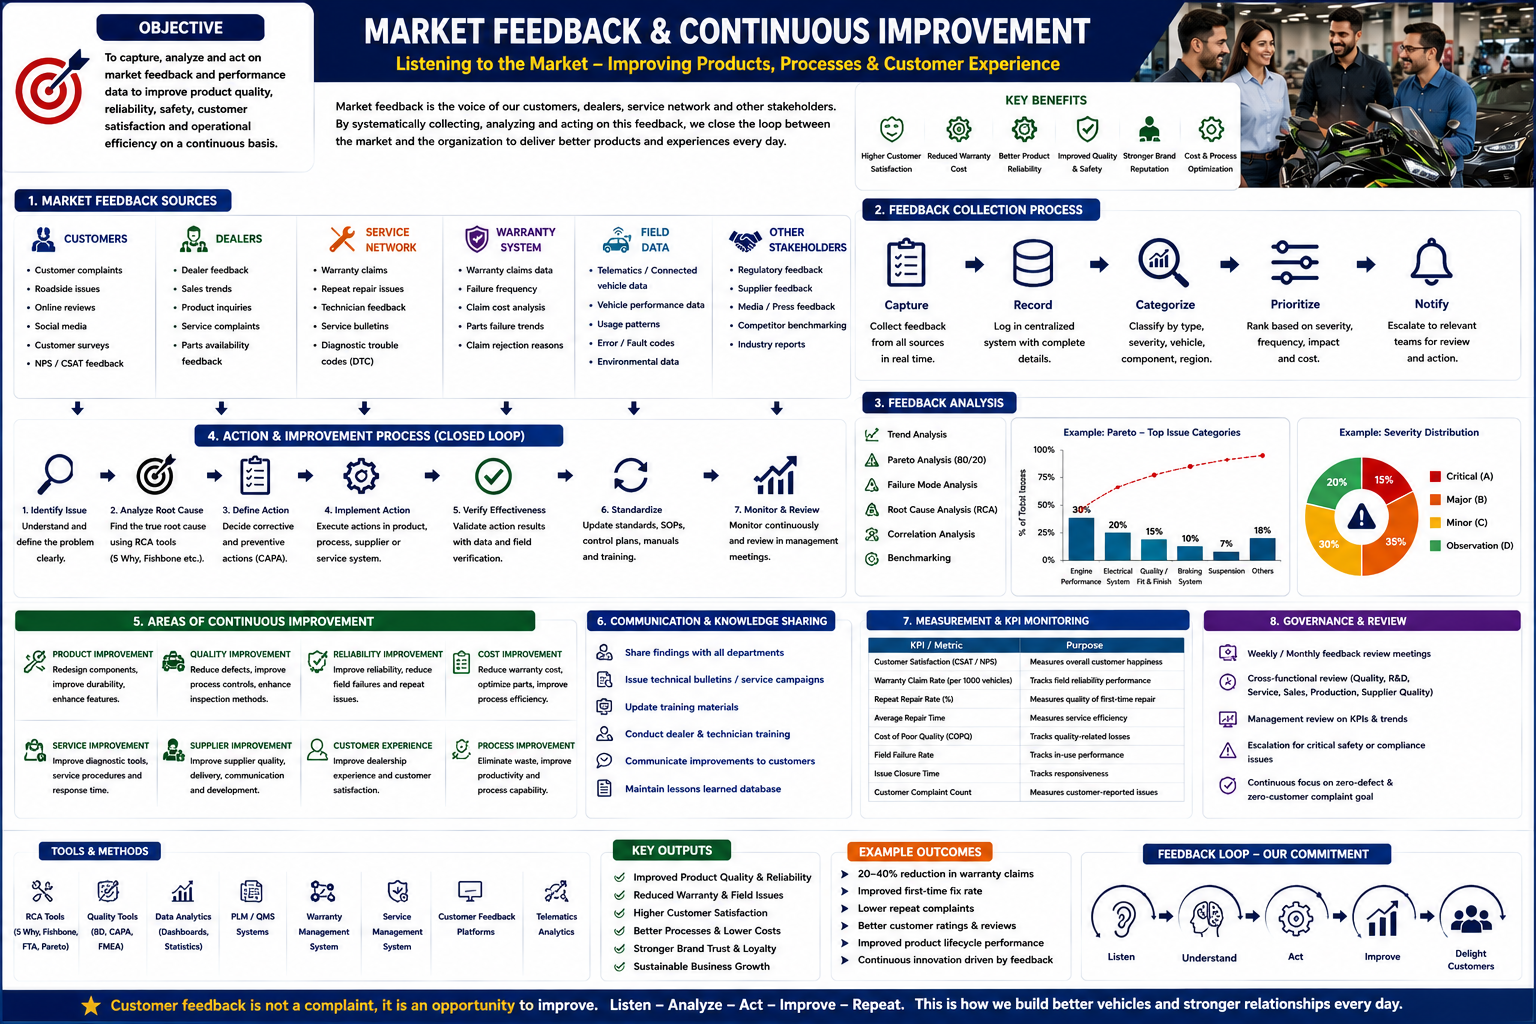
Market Feedback & Continuous Improvement in Automotive Product Development
Listening to the Market, Improving Products, Processes and Customer Experience
Market Feedback and Continuous Improvement is the final phase of the Automotive Product Development Process. After the vehicle is launched and enters mass production, the manufacturer must continuously monitor customer feedback, dealer inputs, service reports, warranty data, field performance and market response.
This phase helps the organization understand how the product is performing in real-world conditions. It also helps identify product issues, process gaps, quality concerns, service difficulties and improvement opportunities.
In simple words, this phase answers the question:
“What are customers, dealers, service teams and the market telling us, and how can we improve the product continuously?”
Market feedback is not only about complaints. It is a powerful source of learning that helps improve product quality, reliability, safety, serviceability, customer satisfaction and future product development.
1. Objective of Market Feedback & Continuous Improvement
The main objective is to capture, analyse and act on market feedback and performance data to improve:
- Product quality
- Product reliability
- Product safety
- Customer satisfaction
- Service efficiency
- Warranty performance
- Supplier quality
- Manufacturing processes
- Future product design
- Brand reputation
A successful organization does not stop after vehicle launch. It continuously listens to the market, analyses feedback, takes corrective actions and improves the product throughout its lifecycle.
2. What is Market Feedback?
Market feedback is the voice of customers, dealers, service networks, warranty systems, field data and other stakeholders after the product enters the market.
It includes information from:
- Customer complaints
- Dealer feedback
- Service reports
- Warranty claims
- Field failure reports
- Telematics data
- Social media feedback
- Online reviews
- Product inquiries
- Regulatory feedback
- Supplier feedback
- Competitor benchmarking
Market feedback shows the real performance of the vehicle after launch. It helps identify whether the product is meeting customer expectations in actual usage conditions.
3. Why Market Feedback is Important
Even after complete design validation, product validation, homologation, pilot build and SOP, some issues may appear only after customers start using the product in real-world conditions.
Market feedback helps identify:
- Repeat failures
- Customer dissatisfaction
- Service difficulty
- Warranty cost increase
- Product misuse patterns
- Dealer concerns
- Supplier quality issues
- Design improvement opportunities
- Future feature expectations
- Safety or compliance concerns
A strong feedback system helps reduce warranty claims, improve reliability and strengthen customer trust.
4. Market Feedback Sources
The image shows seven major sources of market feedback.
4.1 Customers
Customers are the most important feedback source because they directly experience the product.
Customer feedback may include:
- Customer complaints
- Roadside issues
- Online reviews
- Social media comments
- Customer surveys
- NPS / CSAT feedback
- Product likes and dislikes
- Comfort and performance feedback
- Feature expectations
Customer feedback helps understand actual satisfaction level and product acceptance.
4.2 Dealers
Dealers interact with customers daily and understand market requirements closely.
Dealer feedback may include:
- Dealer feedback reports
- Sales trends
- Product inquiries
- Service complaints
- Parts availability feedback
- Customer purchase behaviour
- Price sensitivity
- Competitor feedback
- Regional market requirements
Dealers can provide early signals regarding customer concerns, product demand and service issues.
4.3 Service Network
The service network provides technical feedback from maintenance and repair activities.
Service feedback may include:
- Repair complaints
- Repeat repair issues
- Technician feedback
- Service bulletins
- Diagnostic trouble codes
- Service procedure difficulty
- Tooling issues
- Maintenance concerns
- Time taken for repair
Service feedback is very useful for improving product serviceability and reducing repeat complaints.
4.4 Warranty System
Warranty data is one of the most important sources for reliability improvement.
Warranty feedback may include:
- Warranty claims data
- Failure frequency
- Claim cost analysis
- Parts failure trends
- Claim rejection reasons
- Repeat warranty claims
- High-cost failures
- Supplier-related failures
Warranty analysis helps identify high-priority product and process issues.
4.5 Field Data
Modern vehicles can generate valuable field data, especially through telematics and connected vehicle systems.
Field data may include:
- Telematics data
- Connected vehicle data
- Vehicle performance data
- Usage patterns
- Error codes
- Fault codes
- Environmental data
- Driving behaviour
- Battery performance data for EVs
Field data helps manufacturers understand how vehicles are actually used by customers.
4.6 Other Stakeholders
Other stakeholders also provide valuable feedback.
This may include:
- Regulatory feedback
- Supplier feedback
- Media and press feedback
- Competitor benchmarking
- Industry reports
- Fleet operator feedback
- Government policy signals
- Insurance data, where available
These inputs help the organization improve product planning and future development strategy.
5. Feedback Collection Process
The image shows a structured five-step feedback collection process.
Step 1: Capture
Feedback must be collected from all available sources.
This includes:
- Customer complaints
- Dealer reports
- Service records
- Warranty claims
- Field data
- Online reviews
- Social media comments
- Telematics data
- Supplier inputs
Feedback collection should be systematic and not dependent only on informal communication.
Step 2: Record
All feedback should be logged in a centralized system with complete details.
Important data fields include:
- Vehicle model
- VIN / chassis number
- Engine number, where applicable
- Manufacturing date
- Sale date
- Mileage
- Complaint description
- Failure condition
- Dealer / location
- Part number
- Repair action
- Photos / videos
- Diagnostic codes
- Warranty claim details
Proper recording ensures traceability and supports root cause analysis.
Step 3: Categorize
Feedback should be classified by type, severity, vehicle, component and region.
Typical categories include:
- Engine
- Transmission
- Electrical system
- Braking system
- Suspension
- Body and frame
- Fit and finish
- Software
- Battery system
- Charging system
- Service issue
- Parts issue
- Dealer handling issue
Categorization helps identify patterns and recurring problems.
Step 4: Prioritize
Not all issues have the same urgency. Issues must be ranked based on severity, frequency, impact and cost.
Priority should consider:
- Safety impact
- Regulatory impact
- Customer inconvenience
- Failure frequency
- Warranty cost
- Repair time
- Brand impact
- Production impact
Safety and regulatory issues must receive the highest priority.
Step 5: Notify
After prioritization, issues must be escalated to relevant teams for review and action.
Teams may include:
- R&D
- Quality
- Production
- Supplier Quality
- Service
- Warranty
- Homologation
- Purchase
- Dealer development
- Management
Fast notification improves response time and prevents repeated customer dissatisfaction.
6. Feedback Analysis
Once feedback is collected, it must be analysed using structured tools.
6.1 Trend Analysis
Trend analysis identifies whether issues are increasing, decreasing or stable over time.
It helps answer:
Is the issue increasing month by month?
Is the problem linked to a specific production batch?
Is the issue linked to a specific region?
Is the issue seasonal?
Is the issue linked to a specific supplier lot?
6.2 Pareto Analysis
Pareto analysis follows the 80/20 principle. It helps identify the few major issues that cause most complaints or warranty cost.
For example, if 20% of issues are responsible for 80% of warranty cost, those issues should receive priority attention.
6.3 Failure Mode Analysis
Failure mode analysis identifies how and why a part or system failed.
It may include:
- Failed part inspection
- Dimensional check
- Material analysis
- Functional testing
- Supplier investigation
- Service history review
- Usage condition review
6.4 Root Cause Analysis
Root Cause Analysis helps identify the actual reason behind the problem.
Common methods include:
5 Why Analysis
- Fishbone Diagram
- Fault Tree Analysis
- Failure reproduction test
- Process audit
- Supplier audit
- Data comparison
Root cause analysis prevents temporary fixes and supports permanent corrective action.
6.5 Correlation Analysis
Correlation analysis checks relationships between different data points.
Examples
- Failure vs mileage
- Failure vs temperature
- Failure vs region
- Failure vs production batch
- Failure vs supplier lot
- Failure vs service history
- Failure vs usage pattern
This helps identify hidden causes behind field failures.
6.6 Benchmarking
Benchmarking compares product performance with competitors or previous models.
It helps identify:
- Product gaps
- Customer expectations
- Feature improvement needs
- Quality improvement areas
- Cost competitiveness
- Reliability performance
7. Severity Classification
Feedback should be classified based on severity.
A practical severity classification can be:
Critical issues should be escalated immediately and reviewed by management.
8. Action & Improvement Process — Closed Loop
The image shows a seven-step closed-loop improvement process.
Step 1: Identify Issue
The first step is to clearly define the problem.
A good issue statement should include:
What happened?
When did it happen?
Where did it happen?
Which vehicle or part is affected?
How many cases occurred?
What is the customer impact?
Example:
- “Fuel leakage observed from fuel hose joint in 12 vehicles produced between March and April.”
Step 2: Analyse Root Cause
The team must identify the actual root cause.
Possible root causes may include:
- Design weakness
- Supplier process variation
- Incorrect assembly
- Poor material quality
- Wrong torque
- Software calibration issue
- Service procedure error
- Customer misuse
- Packaging damage
- Environmental condition
Step 3: Define Action
Corrective and preventive actions must be defined.
Actions may include:
- Design change
- Process change
- Supplier correction
- Service bulletin
- Software update
- Training update
- Inspection campaign
- Field repair action
- Production containment
- Warranty policy update
Step 4: Implement Action
The approved action must be implemented in the product, process, supplier system or service network.
Examples
- Change part design
- Update work instruction
- Add poka-yoke
- Revise torque specification
- Improve supplier process control
- Update service manual
- Release technical bulletin
- Replace affected parts in field
Step 5: Verify Effectiveness
Corrective action must be verified using data and field confirmation.
Verification may include:
- Repeat test
- Production audit
- Field monitoring
- Warranty trend reduction
- Customer feedback improvement
- Dealer confirmation
- Supplier process audit
An action should not be closed until effectiveness is proven.
Step 6: Standardize
Successful corrective actions must be standardized.
This may include updating:
- Drawings
- Specifications
- Control plans
- SOPs
- Service manuals
- Training documents
- Supplier standards
- Inspection criteria
- Warranty guidelines
Standardization prevents recurrence.
Step 7: Monitor & Review
After standardization, the issue must be monitored continuously.
Review should include:
- Complaint trend
- Warranty trend
- Repeat failure data
- Customer feedback
- Dealer feedback
- Management review
This completes the closed-loop improvement system.
9. Areas of Continuous Improvement
The image highlights eight major improvement areas.
9.1 Product Improvement
Product improvement includes redesigning components, improving durability and enhancing features.
Examples
- Improve bracket strength
- Improve sealing
- Add protective cover
- Improve wiring harness routing
- Improve cooling performance
- Improve software logic
- Improve ergonomics
9.2 Quality Improvement
Quality improvement focuses on reducing defects and improving process control.
Examples
- Improve inspection method
- Add quality gate
- Improve poka-yoke
- Strengthen supplier audit
- Update control plan
- Reduce variation
- Improve defect containment
9.3 Reliability Improvement
Reliability improvement focuses on reducing field failures and repeat issues.
Examples
- Improve material
- Improve durability
- Improve component life
- Strengthen validation
- Improve service interval
- Improve environmental protection
9.4 Cost Improvement
Cost improvement focuses on reducing warranty cost, scrap, rework and process cost.
Examples
- Reduce repeat failures
- Reduce warranty claim cost
- Improve process efficiency
- Optimize parts
- Reduce repair time
- Improve supplier quality
9.5 Service Improvement
Service improvement helps dealers and service technicians solve issues faster.
Examples
- Improve diagnostic tools
- Improve troubleshooting guide
- Update service procedure
- Reduce service time
- Improve spare parts availability
- Improve technician training
9.6 Supplier Improvement
Supplier improvement focuses on improving supplier quality, delivery and communication.
Examples
- Supplier corrective action
- Process audit
- PPAP update
- Supplier training
- Capacity improvement
- Incoming quality improvement
9.7 Customer Experience Improvement
Customer experience improvement focuses on customer satisfaction and ownership experience.
Examples
- Faster complaint resolution
- Better dealer communication
- Improved product information
- Better service support
- Improved warranty handling
- Better delivery experience
9.8 Process Improvement
Process improvement focuses on productivity and process capability.
Examples
- Reduce cycle time
- Improve line efficiency
- Improve process capability
- Reduce downtime
- Improve data capture
- Improve escalation system
10. Communication & Knowledge Sharing
Feedback analysis is useful only when knowledge is shared across the organization.
Key communication activities include:
Share findings with all departments.
Issue technical bulletins and service campaigns.
Update training materials.
Conduct dealer and technician training.
Communicate improvements to customers where required.
Maintain lessons learned database.
Share recurring issues with design and development teams.
Include learning in future projects.
A lessons learned database is especially important because it prevents old problems from repeating in new models.
11. Measurement and KPI Monitoring
Continuous improvement must be measured using KPIs.
These KPIs help management understand whether improvements are effective.
12. Governance and Review
A strong governance system is required to sustain continuous improvement.
Governance activities include:
- Weekly or monthly feedback review meetings
- Cross-functional review by Quality, R&D, Service, Sales, Production and Supplier Quality
- Management review of KPIs and trends
- Escalation of critical safety or compliance issues
- Continuous focus on zero-defect and zero-customer-complaint goals
- Action tracking until closure
- Review of warranty and field failure trends
Governance ensures that issues do not remain only as reports but are converted into actions.
13. Tools and Methods
The image shows several tools and systems used for feedback analysis and improvement.
RCA Tools
Examples
5 Why Analysis
- Fishbone Diagram
- Fault Tree Analysis
- Pareto Analysis
Quality Tools
Examples
- 8D
- CAPA
- FMEA
- Control charts
- Check sheets
- Histogram
- Scatter diagram
Data Analytics
Examples
- Dashboards
- Statistics
- Trend charts
- Pareto charts
- Severity analysis
PLM / QMS Systems
Used for:
- Issue tracking
- Change management
- Document control
- Corrective action tracking
- Quality records
Warranty Management System
Used to analyse:
- Warranty claims
- Repair cost
- Failure frequency
- Part replacement trends
- Dealers claim patterns
Service Management System
Used to track:
- Service repairs
- Technician observations
- Diagnostic results
- Repeat repairs
- Service campaign status
Customer Feedback Platforms
Used to collect:
- Complaints
- Reviews
- Survey results
- Customer suggestions
- Satisfaction scores
Telematics Analytics
Used to analyse:
- Vehicle usage
- Fault codes
- Vehicle health
- Driving patterns
- Battery performance
- System alerts
14. Key Outputs
The expected outputs from Market Feedback and Continuous Improvement are:
- Improved product quality and reliability
- Reduced warranty and field issues
- Higher customer satisfaction
- Better processes and lower costs
- Stronger brand trust and loyalty
- Sustainable business growth
- Updated service procedures
- Updated design standards
- Updated training material
- Lessons learned database
- Future product improvement inputs
15. Example Outcomes
The image highlights typical improvement outcomes, such as:
20–40% reduction in warranty claims
- Improved first-time fix rate
- Lower repeat complaints
- Better customer ratings and reviews
- Improved product lifecycle performance
- Continuous innovation driven by feedback
These outcomes are possible when feedback is captured properly, analysed scientifically and acted upon quickly.
16. Feedback Loop — Our Commitment
A strong feedback system follows a simple but powerful loop:
Listen → Understand → Act → Improve → Delight Customers
Listen
Collect feedback from customers, dealers, service teams, warranty systems and field data.
Understand
analyse feedback using technical, quality and statistical methods.
Act
Define corrective and preventive actions with clear ownership.
Improve
Update product, process, supplier controls, service procedures or training.
Delight Customers
Deliver better quality, reliability, safety, service experience and ownership satisfaction.
This loop should continue throughout the product lifecycle.
17. Practical Example: Motorcycle Market Feedback
For a motorcycle, market feedback may include:
- Engine starting complaints
- Battery discharge issues
- Brake noise
- ABS warning lamp concern
- Chain noise
- Headlamp condensation
- Fuel leakage
- Vibration at certain RPM
- Clutch cable wear
- Poor spare parts availability
- Dealer service delay
Improvement actions may include:
- Design change
- Service bulletin
- Dealer training
- Supplier correction
- Updated inspection method
- Warranty campaign
- Improved spare parts stock
18. Practical Example: Passenger Car Market Feedback
For a passenger car, feedback may include:
- Door noise
- Water leakage
- Infotainment malfunction
- Air conditioning complaint
- Brake judder
- Engine warning lamp
- Paint defect
- Poor fuel economy
- Interior rattle
- Warranty repeat repair
Improvement actions may include:
- Updated assembly process
- Software update
- Supplier quality improvement
- Better sealing design
- Service diagnostic update
- Production inspection improvement
19. Practical Example: EV Market Feedback
For an electric vehicle, feedback may include:
- Reduced range
- Charging failure
- Battery warning message
- BMS communication issue
- Motor controller fault
- Regenerative braking concern
- Thermal performance issue
- Charging connector damage
- Software update issue
- HV safety warning
Improvement actions may include:
- Software update
- BMS calibration improvement
- Charging system improvement
- Battery thermal management update
- Dealer EV diagnostic training
- Improved HV connector protection
- Telematics-based monitoring
20. Common Challenges in Market Feedback Management
Typical challenges include:
- Feedback not recorded properly
- Dealer data incomplete
- Warranty claim details missing
- Delayed issue escalation
- No clear issue owner
- Poor root cause analysis
- Temporary fixes instead of permanent actions
- Corrective actions not verified
- Weak cross-functional communication
- Lessons learned not captured
- Field data not linked with production data
- Customer complaints not prioritized properly
These challenges can be reduced by using a structured closed-loop feedback system.
21. Best Practices
To make Market Feedback and Continuous Improvement effective:
Create a centralized feedback database.
Record complete vehicle and complaint details.
Prioritize safety and regulatory issues immediately.
Use Pareto analysis to focus on major issues.
Conduct regular cross-functional review meetings.
Assign clear ownership and target dates.
Use 5 Why, Fishbone and 8D for root cause analysis.
Verify corrective action effectiveness.
Update service manuals, SOPs and training material.
Share lessons learned with product development teams.
Monitor warranty trends continuously.
Use field feedback as input for next-generation products.
Treat every customer complaint as an improvement opportunity.
Conclusion
Market Feedback and Continuous Improvement is the closing loop of the Automotive Product Development Process. It ensures that customer experience, dealer feedback, service data, warranty claims and field performance are continuously reviewed and converted into product and process improvements.
A strong feedback system improves product reliability, reduces warranty cost, increases customer satisfaction, supports better service, strengthens brand trust and provides valuable input for future vehicle development.
The final output of this phase is:
A continuously improving product and process system driven by real market feedback, customer experience and field performance data.
Key Takeaways
Market feedback is the voice of customers, dealers, service networks and field data.
Feedback should be captured, recorded, categorized, prioritized and escalated.
Closed-loop improvement includes issue identification, root cause analysis, action, verification, standardization and monitoring.
Key improvement areas include product, quality, reliability, cost, service, supplier, customer experience and process.
KPIs such as warranty claim rate, repeat repair rate, customer satisfaction and issue closure time must be monitored.
Customer feedback is not a complaint; it is an opportunity to improve.
Reference tables from the source chapter
| Severity Level | Description | Example |
|---|---|---|
| Critical A | Safety or regulatory concern | Brake failure, fire risk, major control loss |
| Major B | High customer impact | Engine no-start, repeated breakdown |
| Minor C | Moderate issue | Noise, vibration, minor leakage |
| Observation D | Improvement point | Comfort, feature suggestion, styling feedback |
Reference table 2
| KPI / Metric | Purpose |
|---|---|
| Customer Satisfaction | Measures overall customer happiness |
| CSAT / NPS | Tracks customer loyalty and satisfaction |
| Warranty Claim Rate | Tracks field reliability performance |
| Repeat Repair Rate | Measures quality of first-time repair |
| Average Repair Time | Measures service efficiency |
| Cost of Poor Quality | Tracks quality-related losses |
| Field Failure Rate | Tracks in-use performance |
| Issue Closure Time | Measures responsiveness |
| Customer Complaint Count | Measures customer-reported issues |
| Dealer Complaint Count | Measures dealer-reported concerns |
Frequently asked questions
Which sources make up automotive market feedback?
Customer complaints, dealer and service reports, warranty claims, field data, telematics, surveys, regulatory feedback, suppliers, and public reviews all contribute.
How should feedback be prioritized?
Teams consider safety and compliance severity, customer impact, frequency, detectability, cost, trend, affected population, and urgency.
What closes the feedback loop?
The loop closes only after root cause is understood, corrective action is implemented, effectiveness is verified, standards are updated, and learning is shared.
Related articles
Phase review toolkit
Why this phase matters
Field evidence shows how the product behaves across real customers, environments, usage patterns and service conditions.
Inputs, outputs and gate review
- Inputs: Warranty, diagnostics, dealer reports, customer feedback, incidents, recalls and vehicle data.
- Outputs: Prioritized issues, root causes, corrective actions, product updates and next-program learning.
- Gate-review summary: Confirm severity, population, containment, regulatory reporting needs and effectiveness of the corrective action.
Chapter Checklist
- Inputs are controlled and traceable
- Outputs have an accountable owner and approval status
- Open risks include containment, due date and decision authority
- Configuration and assumptions match downstream evidence
- Compliance and change impacts are recorded